Alumni Feedback on Curriculum
Alumni feedback on curriculum is collected regularly by IQAC which is analysed and necessary updation is carried in the curriculum design and syllabus for the betterment of the student community.
The following parameters are considered to obtain feedback
The syllabus of the course is updated and useful in gaining subject knowledge.
The syllabus of the course gives fundamentals and leads to critical thinking.
Use of syllabus in preparation of competitive examinations
Role of curriculum in increasing confidence in pursuing higher studies
syllabus of the programme resulting in learning of job oriented skills
Role of syllabus in improving the leadership and communication skill
Role for syllabus while writing summative semester examination
Role of syllabus in getting and doing present hob easily
Scope of programme in sharpening personality
Scope of syllabus in promoting ethical behavior in my personal as well as personal life
No. of Respondents per Year
| Total No.of Respondents | 532 |
|---|
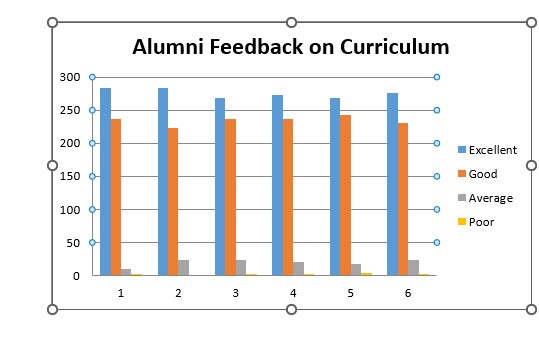
| Q.No. | Excellent | Good | Average | Poor | ||||
| No | % | No | % | No | % | No | % | |
| 1 | 284 | 53 | 236 | 44 | 10 | 2 | 2 | 0 |
| 2 | 284 | 53 | 223 | 42 | 24 | 5 | 1 | 0 |
| 3 | 269 | 51 | 236 | 44 | 24 | 5 | 3 | 1 |
| 4 | 273 | 51 | 236 | 44 | 21 | 4 | 2 | 0 |
| 5 | 268 | 50 | 242 | 45 | 18 | 3 | 4 | 1 |
| 6 | 276 | 52 | 231 | 43 | 23 | 4 | 2 | 0 |
| Total No.of Respondents | 287 |
|---|
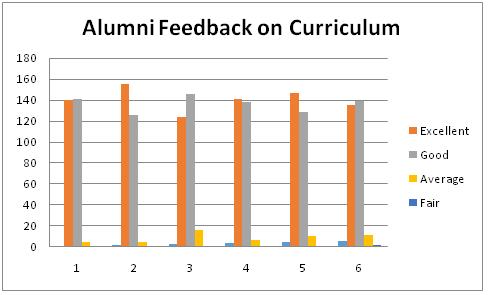
| Q.No. | Excellent | Good | Average | Poor | ||||
| No | % | No | % | No | % | No | % | |
| 1 | 140 | 49 | 141 | 49 | 5 | 2 | 1 | 0 |
| 2 | 155 | 54 | 126 | 44 | 5 | 2 | 1 | 0 |
| 3 | 124 | 43 | 146 | 51 | 16 | 6 | 1 | 0 |
| 4 | 141 | 49 | 138 | 48 | 7 | 2 | 1 | 0 |
| 5 | 147 | 51 | 129 | 45 | 10 | 3 | 1 | 0 |
| 6 | 135 | 47 | 139 | 48 | 11 | 4 | 2 | 1 |
| Total No. of Respondents | 761 |
|---|
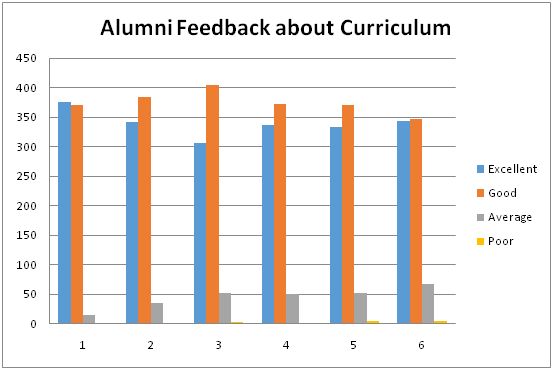
| Q. No | Excellent | Good | Average | Poor | ||||
|---|---|---|---|---|---|---|---|---|
| No | % | No | % | No | % | No | % | |
| 1 | 376 | 49 | 370 | 49 | 15 | 2 | 0 | 0 |
| 2 | 342 | 45 | 384 | 50 | 35 | 5 | 0 | 0 |
| 3 | 306 | 40 | 405 | 53 | 53 | 7 | 3 | 0 |
| 4 | 336 | 44 | 373 | 49 | 51 | 7 | 1 | 0 |
| 5 | 333 | 44 | 370 | 49 | 53 | 7 | 5 | 1 |
| 6 | 343 | 45 | 347 | 46 | 67 | 9 | 4 | 1 |
| Total No. of Respondents | 340 |
|---|
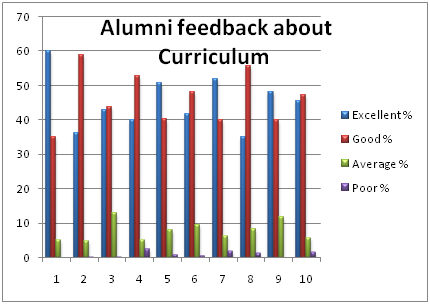
| Q. No | Excellent | Good | Average | Poor | ||||
|---|---|---|---|---|---|---|---|---|
| No | % | No | % | No | % | No | % | |
| 1 | 204 | 60 | 119 | 35 | 17 | 5 | 0 | 0 |
| 2 | 123 | 36 | 200 | 59 | 16 | 5 | 1 | 0 |
| 3 | 146 | 43 | 149 | 44 | 44 | 13 | 1 | 0 |
| 4 | 136 | 40 | 179 | 53 | 17 | 5 | 8 | 2 |
| 5 | 173 | 51 | 137 | 40 | 27 | 8 | 3 | 1 |
| 6 | 142 | 42 | 164 | 48 | 32 | 9 | 2 | 1 |
| 7 | 177 | 52 | 136 | 40 | 21 | 6 | 6 | 2 |
| 8 | 119 | 35 | 189 | 56 | 28 | 8 | 4 | 1 |
| 9 | 164 | 48 | 136 | 40 | 40 | 12 | 0 | 0 |
| 10 | 155 | 46 | 161 | 47 | 19 | 6 | 5 | 1 |
| Total No. of Respondents | 281 |
|---|
| Q. No | Excellent | Good | Average | Poor | ||||
|---|---|---|---|---|---|---|---|---|
| No | % | No | % | No | % | No | % | |
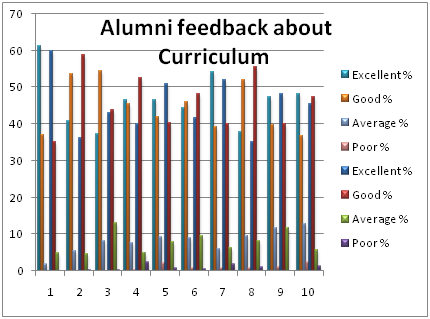
| 1 | 172 | 61 | 104 | 37 | 5 | 2 | 0 | 0 |
| 2 | 115 | 41 | 151 | 54 | 15 | 5 | 0 | 0 |
| 3 | 105 | 37 | 153 | 54 | 23 | 8 | 0 | 0 |
| 4 | 131 | 47 | 128 | 46 | 21 | 7 | 1 | 0 |
| 5 | 131 | 47 | 118 | 42 | 26 | 9 | 6 | 2 |
| 6 | 125 | 44 | 129 | 46 | 25 | 9 | 2 | 1 |
| 7 | 152 | 54 | 110 | 39 | 17 | 6 | 2 | 1 |
| 8 | 106 | 38 | 146 | 52 | 27 | 10 | 2 | 1 |
| 9 | 133 | 47 | 112 | 40 | 33 | 12 | 3 | 1 |
| 10 | 135 | 48 | 103 | 37 | 36 | 13 | 7 | 2 |
| Total No. of Respondents | 281 |
|---|
| Q. No | Excellent | Good | Average | Poor | ||||
|---|---|---|---|---|---|---|---|---|
| No | % | No | % | No | % | No | % | |
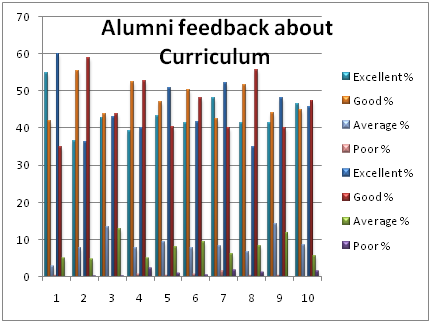
| 1 | 154 | 55 | 118 | 42 | 8 | 3 | 1 | 0 |
| 2 | 103 | 37 | 156 | 56 | 22 | 8 | 0 | 0 |
| 3 | 120 | 43 | 123 | 44 | 38 | 14 | 0 | 0 |
| 4 | 110 | 39 | 147 | 52 | 22 | 8 | 2 | 1 |
| 5 | 122 | 43 | 132 | 47 | 26 | 9 | 1 | 0 |
| 6 | 116 | 41 | 141 | 50 | 22 | 8 | 2 | 1 |
| 7 | 135 | 48 | 119 | 42 | 23 | 8 | 4 | 1 |
| 8 | 116 | 41 | 145 | 52 | 19 | 7 | 1 | 0 |
| 9 | 116 | 41 | 124 | 44 | 40 | 14 | 1 | 0 |
| 10 | 131 | 47 | 126 | 45 | 24 | 9 | 0 | 0 |
| Total No. of Respondents | 228 |
|---|
| Q. No | Excellent | Good | Average | Poor | ||||
|---|---|---|---|---|---|---|---|---|
| No | % | No | % | No | % | No | % | |
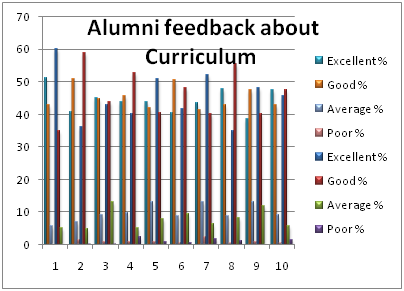
| 1 | 117 | 51.3158 | 98 | 42.9825 | 13 | 5.70175 | 0 | 0 |
| 2 | 93 | 40.7895 | 116 | 50.8772 | 16 | 7.01754 | 3 | 1.31579 |
| 3 | 103 | 45.1754 | 102 | 44.7368 | 21 | 9.21053 | 2 | 0.87719 |
| 4 | 100 | 43.8596 | 104 | 45.614 | 22 | 9.64912 | 2 | 0.87719 |
| 5 | 100 | 43.8596 | 96 | 42.1053 | 30 | 13.1579 | 2 | 0.87719 |
| 6 | 92 | 40.3509 | 115 | 50.4386 | 20 | 8.77193 | 1 | 0.4386 |
| 7 | 99 | 43.4211 | 94 | 41.2281 | 30 | 13.1579 | 5 | 2.19298 |
| 8 | 109 | 47.807 | 98 | 42.9825 | 20 | 8.77193 | 1 | 0.4386 |
| 9 | 88 | 38.5965 | 108 | 47.3684 | 30 | 13.1579 | 2 | 0.87719 |
| 10 | 108 | 47.3684 | 98 | 42.9825 | 21 | 9.21053 | 1 | 0.4386 |
| Total No. of Respondents | 206 |
|---|
| Q. No | Excellent | Good | Average | Poor | ||||
|---|---|---|---|---|---|---|---|---|
| No | % | No | % | No | % | No | % | |
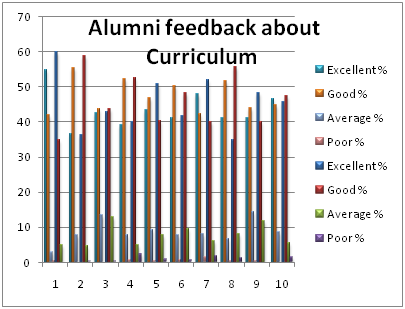
| 1 | 119 | 58 | 81 | 39 | 6 | 3 | 0 | 0 |
| 2 | 84 | 41 | 106 | 51 | 15 | 7 | 1 | 0 |
| 3 | 91 | 44 | 93 | 45 | 22 | 11 | 0 | 0 |
| 4 | 91 | 44 | 102 | 50 | 13 | 6 | 0 | 0 |
| 5 | 105 | 51 | 86 | 42 | 15 | 7 | 0 | 0 |
| 6 | 79 | 38 | 100 | 49 | 27 | 13 | 0 | 0 |
| 7 | 110 | 53 | 79 | 38 | 15 | 7 | 2 | 1 |
| 8 | 74 | 36 | 113 | 55 | 19 | 9 | 0 | 0 |
| 9 | 88 | 43 | 89 | 43 | 27 | 13 | 2 | 1 |
| 10 | 99 | 48 | 34 | 17 | 69 | 33 | 4 | 2 |
